Beginner’s Guide to Using Fibonacci Retracement Without the Jargon
You might have come across the term Fibonacci retracement, especially when you’re new to trading or investing. It doesn’t seem that easy, but it’s a very helpful tool when you know how to use it. In simple terms, let’s break it down.
What is the Fibonacci Retracement?
Fibonacci retracement is a technical analysis tool that helps predict possible levels of resistance and support in the market. These levels enable traders to identify where the market may turn around after a significant move, either downwards or upwards. It works on a series of numbers discovered by the mathematician Leonardo Fibonacci during the 13th century.
The sequence itself may sound like a scholarly idea, but applying this method to trading is straightforward and efficient. Traders use certain ratios in this sequence to draw lines on a chart, which help them identify price ranges that are likely to experience a reversal in trend direction. Consider it a map directing traders to areas where price movements may decrease or reverse.
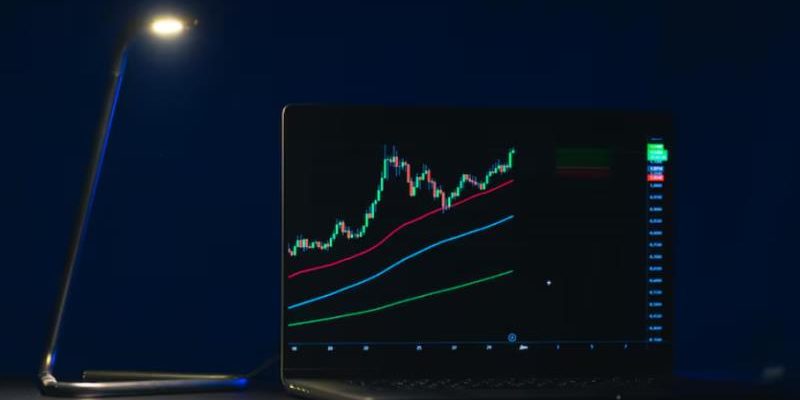
How About Using Fibonacci Retracement in Trading
When viewing a price chart, the Fibonacci retracement tool usually appears as a horizontal lines that you draw between a major low and high points on the chart.
After being applied, the tool will automatically reveal primary retracement levels, such as 23.6%, 38.2%, 50%, 61.8%, and, in some cases, 78.6%. These numbers are based on the Fibonacci sequence.
Here’s How to Apply It in Simple Steps
Determine the Trend: To begin with, locate a strong upward or downward trend in the market. The trend should be evident — either the price has been increasing or decreasing drastically.
Choose Your High/Low: The Fibonacci retracement tool requires two key points: the highest point (when the trend is up) or the lowest point (when the trend is down) of the price movement.
Use the Tool: You can use your charting software and add the Fibonacci retracement tool from the beginning to the end of the trend. The software will automatically create horizontal lines at the levels you need to monitor.
Monitor Reversals: After using the tool, observe the price reaction at the retracement levels. If the price starts to slow down or reverse near one of these levels, it might be an indication that the trend is changing direction.
The key Fibonacci levels (38.2%, 50%, and 61.8%) are the ones most traders watch closely. These levels are often viewed as zones where the price could pause and reverse, making them crucial for setting entry and exit points.
Final Verdict
Fibonacci retracement is a straightforward yet powerful tool that can help you identify potential turning points in the market. As you gain more experience with this tool, you’ll become better at spotting high-probability trade setups and avoiding false signals.
Now that you have the basics down, try using Fibonacci retracement on a demo account or in your charts. With a bit of practice, you’ll soon see why it’s such a popular tool in the world of technical analysis.